In the world of AI and ML, Data is Everything — but how you see that data makes all the difference.
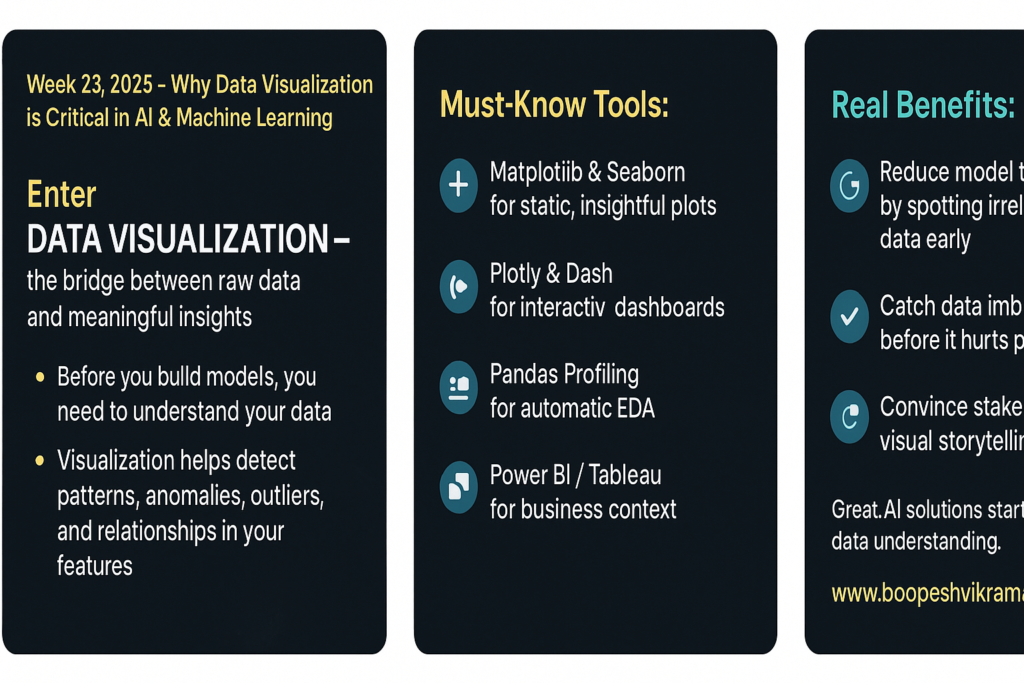
✨ Enter Data Visualization — the bridge between raw data and meaningful insights.
📈 Why It Matters:
- Before you build models, you need to understand your data.
- Visualization helps detect patterns, anomalies, outliers, and relationships in your features.
- It aids in feature engineering, data cleaning, and even selecting the right algorithms.
✅ Must-Know Tools:
- Matplotlib & Seaborn for static, insightful plots.
- Plotly & Dash for interactive dashboards.
- Pandas Profiling for automatic EDA.
- Power BI / Tableau for business context.
📊 Real Benefits:
- Reduce model training time by spotting irrelevant data early.
- Catch data imbalance before it hurts performance.
- Convince stakeholders with visual storytelling, not just metrics.
🔍 Remember:
Great AI solutions start with great data understanding.
And that begins with the power of visuals.
Let’s master the art of seeing data — because what you can see, you can shape.
📌 For more weekly insights on AI, ML & Productivity —
🌐 Follow: www.boopeshvikram.com
#AI #MachineLearning #DataVisualization #MLTips #AIForEveryone #LinkedInSeries #BoopeshVikram #DataScience